Tweezers Bottom Candlestick Pattern: Complete Trading Guide 📊
Tweezer Bottoms are like precision pliers gripping the market floor – they mark the exact spot where bears ran out of steam and bulls decided “this low is low enough!” 🔧📏

- Pattern Type: Two Candle
- Direction: Bullish (the floor inspector of patterns)
- Alternative Names: Twin Bottoms, Double Bottom Candles
- Reliability Score: 0.62 (solid above-average performance)
- Win Rate: 52-60% (respectable reversal odds)
- Best For: Identifying exact reversal points at market bottoms
📋 Pattern Classifications
- Pattern Type: Two Candle Pattern
- Market Direction: Bullish Reversal Signal
- Pattern Category: Reversal Pattern
- Pattern Family: Tweezers Family
- Reversal vs Continuation: Reversal Signal
- Best Timeframes: Daily, Weekly Charts
- Volume Dependency: Higher volume on second day strengthens pattern
- Optimal Prior Trend: Downtrend (the steeper the decline, the more significant the tweezers)
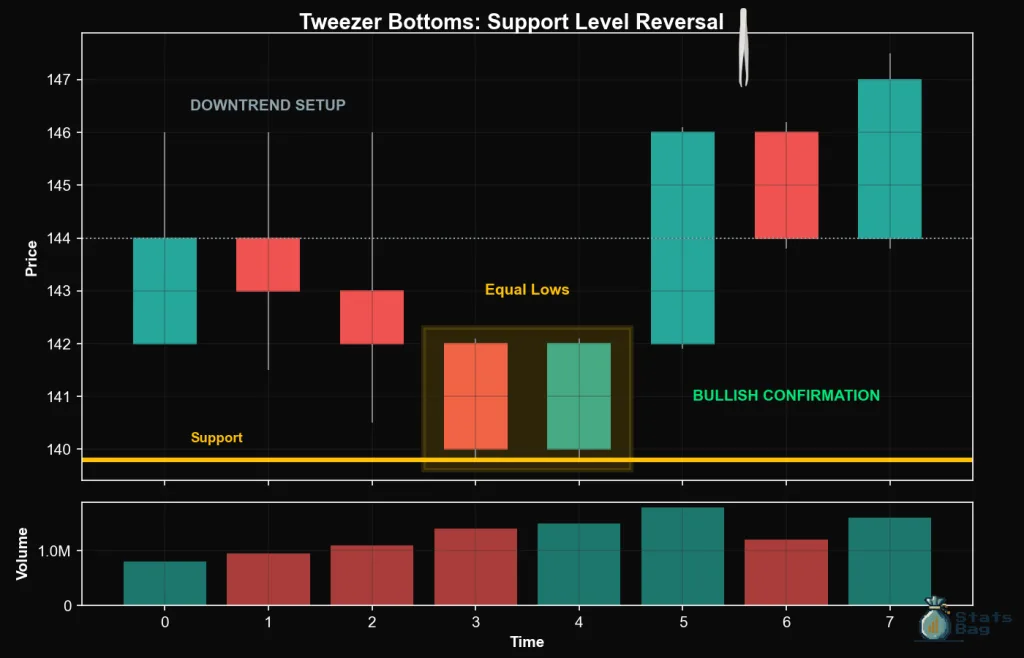
📊 What Does It Look Like?
Picture precision tweezers pinching the exact same spot twice – that’s your Tweezers Bottom! Two consecutive candles with identical (or nearly identical) lows, like the market tested a level and said “nope, not going lower!” 🔧📐

Formation Criteria:
- Two consecutive candlesticks with identical or nearly identical lows
- First candle is typically bearish (red)
- Second candle is typically bullish (green)
- The lows should be within a few ticks of each other
- Must appear after a downtrend or at support levels
- Pattern can extend to three or more candles with same lows
Visual Key: If you can draw a horizontal line that touches the lows of both candles perfectly, you’ve found a Tweezers Bottom! 📏
🧠 Market Psychology
The tweezers Bottom tells a story of precise support discovery:
- Day 1: Bears push prices to a new low (testing support)
- Day 1 Reality: Strong buying emerges at this exact level
- Day 2: Bears try again, hitting the SAME low
- Day 2 Rejection: Buyers step in again – “not going lower!”
What This Really Means:
- Strong support level discovered – buyers are organized
- Bears tested the low twice and failed both times
- Value buyers are stepping in at this precise level
- Market has found its “fair value” floor
- Selling pressure is being absorbed consistently
📈 Trading Strategy
⚡ Entry Strategy:
The Tweezers Bottom is your “floor has been found” signal!
- Pattern Completion: Wait for second candle to confirm the identical low
- Volume Analysis: Higher volume on second day = stronger support
- Support Confirmation: Most powerful at major support zones
🎯 Entry Rules:
- Conservative Entry: Buy on break above second candle’s high
- Aggressive Entry: Buy at close of second candle
- Support Entry: Buy any dip back to the tweezers low level
- Confirmation Entry: Wait for third candle to confirm upward momentum
💰 Profit Targets:
- Quick Target: Previous resistance or swing high
- Support-Resistance: Next logical resistance level
- Trend Reversal: Trail stops if strong uptrend develops
📚 Key Takeaways
- 🔧 Precision support signal – 0.62 reliability score
- 📍 Exact level identification – tweezers mark the spot
- 📊 Volume confirms strength – higher volume = stronger support
- 💪 Shows buyer organization – consistent support at same level
- 🎯 Double-tested floor – bears failed twice
Bottom Line: The tweezers Bottom is like watching a craftsman measure twice and cut once – the market tested the low precisely and decided it’s the perfect floor! 🔧📈
See Also: Tweezers Top, White Marubozu, Black Marubozu, Marubozu Open, Marubozu Close, Bullish Engulfing, Bearish Engulfing, Bullish Harami, Bearish Harami
📒Full Candlestick Pattern Guide
- 🕐 Learn Candlestick Patterns Fast – Spot Profitable Signals in 5 Minutes
- ✅ Candlestick Patterns That Work – Highest Success Rate Signals
- 🏯 Japanese Candlestick Patterns: History and Psychology
- 🛠️ Candlestick Patterns for Beginners – Your Complete Starter Guide
- 🤿 How to Read Candlestick Patterns – Components Deep Dive
Disclaimer: This is educational content only, based on common investment and trading industry knowledge. This is not financial advice, and we are not financial advisors. Always speak with a professional financial advisor before investing. Use of this content is at your own risk.