✨ II.A. Candlestick Patterns for Beginners – Your Complete Starter Guide
- 🔍 Learn to read candlestick charts step-by-step with simple language and clear examples.
- 🔢 Master 5 beginner-friendly patterns that work in real trading situations.
- ✅ Start trading confidently with a 7-day action plan and checklist.
🔬 How to Read Candlestick Patterns in 10 Minutes
Candlestick patterns are visual price signals used by traders to understand what buyers and sellers are doing. Think of them as the “emotions” of the market, captured in a single candle.
The Anatomy of a Candlestick
- Open: Where the price started in that time period
- Close: Where it ended
- High: The highest price reached
- Low: The lowest price reached
The thick part is called the body. If it’s green (or white), the price went up. If it’s red (or black), it went down. The thin lines above and below are wicks or shadows.

✅ Quick Tip: Long wicks often signal rejection or uncertainty. Small bodies with long wicks = indecision.
Practice Exercise
Go to TradingView, open a stock like GOOG, and try to identify one green and one red candle. Ask: What does this candle tell me about who was in control?
🔹 5 Essential Candlestick Patterns Every Beginner Must Know
Start with these simple, high-impact patterns. Mastering them gives you a strong foundation.
1. Hammer (Bullish)
- Small green body, long lower wick
- Appears after a downtrend
- Signals a potential reversal up

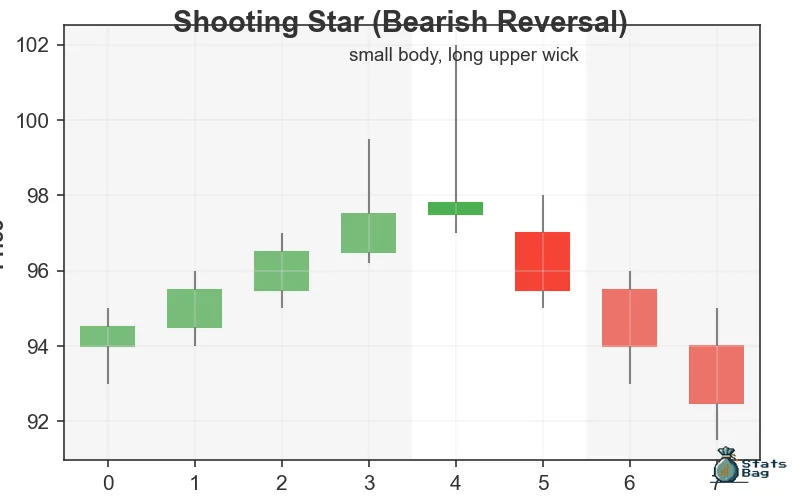
2. Shooting Star (Bearish)
- Small red body, long upper wick
- Appears after an uptrend
- Warns of a possible reversal down
3. Doji (Neutral)
- Very small or no body
- Equal upper and lower wicks
- Market indecision

4. Bullish Engulfing
- Small red candle followed by large green candle
- Green fully “engulfs” red
- Strong bullish reversal signal

5. Bearish Engulfing
- Small green candle followed by large red candle
- Red fully “engulfs” green
- Bearish reversal signal

🧐 Avoid This: Trading a pattern without confirming trend direction or volume can lead to false signals.
⚖️ Candlestick Pattern Basics: Open, High, Low, Close Explained
Every candle is built from OHLC data:
- O = Open: Price at the beginning of the candle’s time period
- H = High: Highest price reached during that period
- L = Low: Lowest price reached
- C = Close: Price at the end
Timeframes matter! A 1-minute candle tells a different story than a daily candle.
| 🕛 Timeframe | 📅 Typical Use |
|---|---|
| 1m | Scalping / very fast trades |
| 5m | Intraday setups |
| 1h | Swing trade entries |
| 1d | Long-term signals |
🗓️ Pro Tip: Use longer timeframes to confirm signals before entering on shorter ones.
✍️ Your First Week Trading Candlestick Patterns
Here’s a 7-day plan to go from total beginner to confident pattern reader.
🧬 Day 1: Learn Anatomy
- Study candle components (OHLC)
- Identify bullish vs bearish candles
Start by reviewing the basic structure of a candlestick. Focus on the open, high, low, and close to understand how each candle forms.
🧠 Day 2: Master Basic Patterns
- Focus on the 5 beginner patterns
- Print this page a cheat sheet
Study the Hammer, Doji, Bullish and Bearish Engulfing, and Shooting Star. Go to Most Active Stocks on Yahoo Finance. Click any stock. When it (finally) appears, click the double-arrows to expand the chart. Then, click mountain 🏔️ and switch to candle 🕯️ view instead. Use your mouse wheel to zoom in to the candles. Look for the patterns we covered and take screenshots.
🔍 Day 3: Spot Patterns in Charts
- Review active stocks
- Screenshot patterns you see
Open TradingView or Yahoo Finance, pick a stock, and switch to the 1-hour chart. Try spotting each of the 5 beginner patterns from Day 2. Save screenshots to compare later.
🌐 Day 4: Understand Context
- Learn about trends
- Are patterns forming in uptrend, downtrend, or sideways?
Open TradingView, pick a stock, and switch to the 4-hour chart. This is a popular timeframe traders use as a starting point. Zoom out and identify the overall trend before interpreting a candlestick pattern. Patterns in the wrong context can mislead. Learn to pair patterns with market direction for stronger signals.
📊 Day 5: Add Volume
- Does volume support the pattern?
- Higher volume = stronger pattern
On TradingView, click the Indicators button at the top, then type and select Volume to add it to your chart. Check whether volume spikes on patterns you spot. Confirmation with volume often means a more reliable signal.
🎮 Day 6: Practice With a Simulator
- Use a paper trading account
- Try entering a trade based on a pattern
Sign up with a broker that allows paper trading, so you can practice without risk. You can find a list at NerdWallet. Enter a trade when a pattern forms, and set stop-loss and take-profit levels. Record the outcome for review.
🔁 Day 7: Reflect and Improve
- What worked? What confused you?
- Revisit any weak areas
Look back at your screenshots and practice trades. Which patterns worked well? Which didn’t? Identify where you need more practice and review previous lessons as needed.
📓 Download your Progress Tracking Checklist to stay on course (coming soon).
You’re Doing Great!
Candlestick patterns give you a window into market psychology. Start with a few basic patterns and build from there. Focus on understanding the story behind each candle—who’s winning, who’s losing, and what might happen next.
📘 Next Step: How to Read Candlestick Patterns (Deep Dive)
📒Full Candlestick Pattern Guide
- 🕐 Learn Candlestick Patterns Fast – Spot Profitable Signals in 5 Minutes
- ✅ Candlestick Patterns That Work – Highest Success Rate Signals
- 🏯 Japanese Candlestick Patterns: History and Psychology
- 🛠️ Candlestick Patterns for Beginners – Your Complete Starter Guide
- 🤿 How to Read Candlestick Patterns – Components Deep Dive
Disclaimer: This is educational content only, based on common investment and trading industry knowledge. This is not financial advice, and we are not financial advisors. Always speak with a professional financial advisor before investing. Use of this content is at your own risk.