Hanging Man Candlestick Pattern: Complete Trading Guide 📊
The Hanging Man is the ominous party crasher of bull markets – it appears just when everyone’s celebrating, dangling like a warning sign that the good times might be ending! 🎉➡️😰

- Pattern Type: Single Candle
- Direction: Bearish (the buzzkill of uptrends)
- Alternative Names: Hammer Top, Hanging Man Hammer, Inverted Hammer (in uptrend)
- Reliability Score: 0.52 (slightly above average)
- Win Rate: Moderate (when confirmed, it packs a punch)
- Best For: Spotting the end of bullish rallies
📋 Pattern Classifications
- Pattern Type: Single Candle Pattern
- Market Direction: Bearish Reversal Signal
- Pattern Category: Reversal Pattern
- Pattern Family: Hammer Family
- Reversal vs Continuation: Potential Reversal Signal
- Best Timeframes: Daily, Weekly Charts
- Volume Dependency: Higher volume strengthens bearish signal
- Optimal Prior Trend: Uptrend (the higher the climb, the harder the fall)
📊 What Does It Look Like?
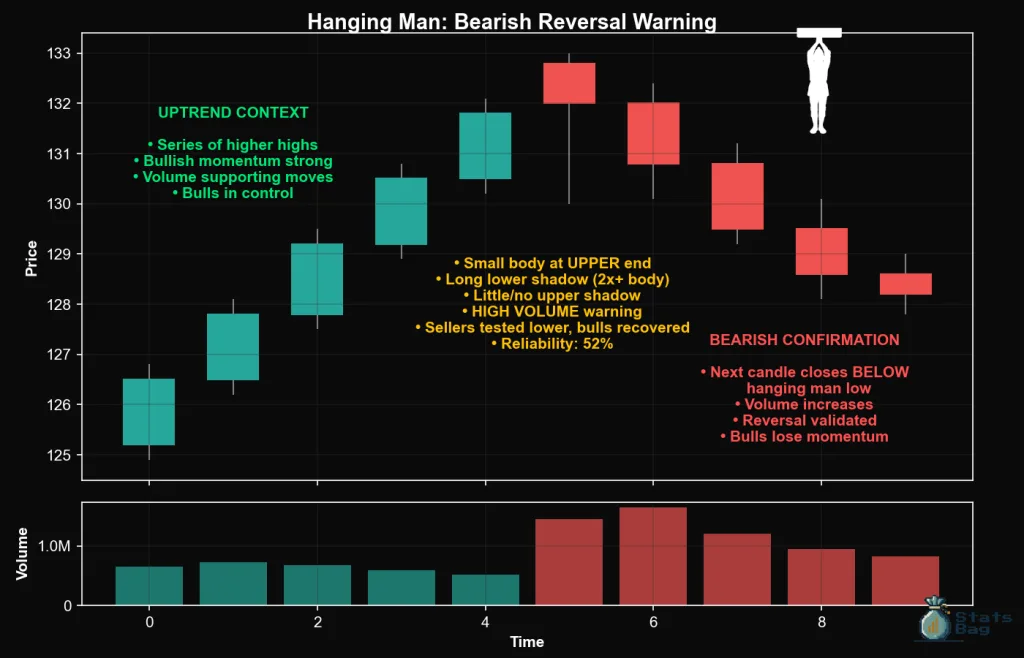
Picture a person hanging by their fingertips from a cliff – that’s your Hanging Man! It has a small body perched at the top of the range with a long lower shadow dangling below, like someone desperately clinging to higher prices. 🧗♂️💥

Formation Criteria:
- Small real body positioned at the upper end of the trading range
- Long lower shadow (at least 2-3 times the body length)
- Little to no upper shadow (minimal upside wick)
- Body can be bullish (green) or bearish (red) – structure matters more than color
- Must appear during an established uptrend for maximum significance
Visual Key: If it looks like a hammer that someone hung upside down from the ceiling, with the “handle” pointing down, you’ve spotted the Hanging Man! 🔨⬇️
🧠 Market Psychology
The Hanging Man tells a disturbing tale of weakening bulls that unfolds like this:
- Opening: Bulls maintain control, keeping prices near recent highs
- The Attack: Sellers suddenly emerge, pushing prices down significantly
- The Recovery: Bulls fight back, but with noticeably less conviction
- The Warning: Price closes near the highs, but the damage is done!
What This Really Means:
- Sellers are starting to show up at higher price levels
- Bulls are losing their aggressive buying power
- The uptrend momentum is beginning to crack under pressure
- Smart money might be quietly distributing shares
- The long lower shadow shows selling pressure is building
📈 Trading Strategy
⚡ Entry Strategy:
The Hanging Man is your “party might be ending” warning signal, but confirmation is absolutely essential!
- Never Short Immediately: The Hanging Man needs bearish confirmation
- Wait for Breakdown: Next candle should close below the Hanging Man’s body
- Volume Matters: Higher volume on confirmation = stronger reversal signal
🎯 Entry Rules:
- Conservative Short: Sell when next candle closes below Hanging Man’s low
- Aggressive Short: Short on intraday break below Hanging Man’s body with volume
- Scale-In Method: Half position on confirmation, half on any bounce back test
- Best Setups: At major resistance levels or after extended rallies
🛑 Stop Loss Placement:
- Standard Stop: Above the Hanging Man’s high
- Tight Stop: Above the midpoint of the body for aggressive traders
- Resistance Stop: Above the nearest significant resistance level
💰 Profit Targets:
- Quick Target: 1:2 risk-reward to first support level
- Swing Target: Previous significant low or support zone
- Trend Change: Use trailing stops if downtrend develops
⚠️ Common Pitfalls
Don’t Fall Into These Hanging Man Traps:
- ❌ Shorting Without Confirmation: The pattern alone is NOT a sell signal!
- ❌ Ignoring the Uptrend Context: Hanging Men in downtrends are just bounces
- ❌ Missing the Volume Component: Low volume confirmations often fail
- ❌ Poor Location Recognition: Mid-uptrend Hanging Men are often just pullbacks
- ❌ Fighting Strong Momentum: Don’t short into powerful breakouts
🚨 False Signal Warning: In news-driven rallies or during earnings beats, Hanging Men can be misleading. Always check the fundamental backdrop!
🔍 Pro Tips
Level Up Your Hanging Man Game:
- 🕐 Perfect Timing: Daily/weekly charts during overbought conditions work best
- 📍 Location Hunting: Major resistance, round numbers, or previous breakout levels
- 🔗 Oscillator Warnings: RSI above 70 + Hanging Man = danger zone
- 📊 Multiple Timeframes: Weekly overbought + daily Hanging Man = high probability short
- 🎭 Psychology Matters: Look for signs of distribution and smart money selling
Advanced Recognition Tips:
- Perfect Hanging Man: Lower shadow 3x body size, minimal upper shadow
- Color Clues: Red body slightly more bearish than green, but both work
- Gap Variations: Even more ominous when gapping up then forming the pattern
📚 Key Takeaways
Remember These Hanging Man Essentials:
- 🎭 It’s a bearish reversal warning – but confirmation is mandatory!
- 📍 Location determines lethality – resistance levels and overbought conditions are key
- ⏰ Never short the pattern alone – always wait for bearish confirmation
- 📊 Volume validates the breakdown – higher volume = higher conviction
- 📈 Works best after rallies – the more extended the uptrend, the more potent
- 🎯 Risk management saves accounts – even good short signals can reverse
Bottom Line: The Hanging Man is like seeing cracks in a dam – it looks stable on the surface, but pressure is building underneath. When you get that bearish confirmation, it often marks the beginning of significant declines! 🎭📉
Trade cautiously, and may your Hanging Men hang the bulls out to dry! 🎪💰
📒Full Candlestick Pattern Guide
- 🕐 Learn Candlestick Patterns Fast – Spot Profitable Signals in 5 Minutes
- ✅ Candlestick Patterns That Work – Highest Success Rate Signals
- 🏯 Japanese Candlestick Patterns: History and Psychology
- 🛠️ Candlestick Patterns for Beginners – Your Complete Starter Guide
- 🤿 How to Read Candlestick Patterns – Components Deep Dive
Disclaimer: This is educational content only, based on common investment and trading industry knowledge. This is not financial advice, and we are not financial advisors. Always speak with a professional financial advisor before investing. Use of this content is at your own risk.